Top Linux Tools to Monitor CPU Usage
Keep your CPU usage in check by monitoring it with these tools on a Linux OS.

Keeping your computer systems from getting overloaded is no small task. Oversizing servers isn’t always an option, so it’s important to keep a close eye on your system resources. Your CPU usage is typically one of the first components that gets bottlenecked when there are spikes of activity. Here is a list of useful Linux tools to help you keep track of your CPU usage.
CPU Monitoring Commands for Linux
Here is a list of valuable tools to help monitor and diagnose potential CPU hogs.
uptime
To get a quick glance at your CPU usage, you can use the very simple uptime command.
$ uptime
20:57:33 up 233 days, 6:33, 1 user, load average: 0.18, 0.07, 0.01
By default, this command will show you the amount of time the server will be running and the load average of the CPU. The load average will be a snapshot of the CPU load at the time you run the command and will not continuously update.
top
You can run the top command for a more comprehensive look at CPU usage.
$ top
Once run, this command launches an interactive terminal that continuously updates the CPU usage, memory, and details on the active processes. The processes will present themselves in descending order, with the highest CPU usage process first. If you have a process that’s hogging your CPU, this will provide you with an immediate look at the PID of the process and the COMMAND it’s running from.
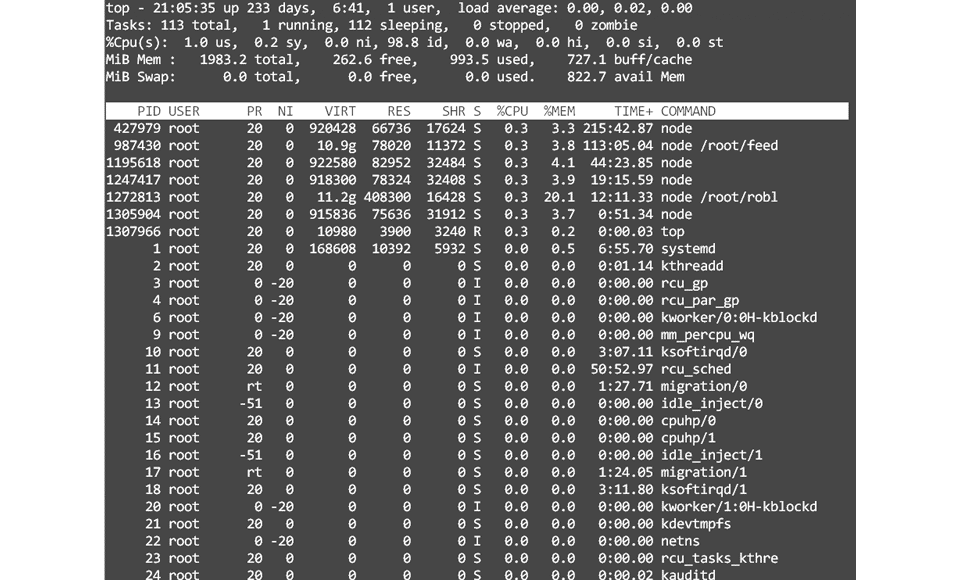
The 3rd line from the top of the screen provides you with details on the CPU usage. There are eight different categories:
- us (user): CPU time spend running user processes
- sy (system): CPU time spent running system processes
- ni (nice user): CPU time spent running processes with the nice command
- id (idling): CPU time spent idling
- wa (waiting): CPU time spent waiting
- hi (hardware interrupts): CPU time spent serving hardware interrupts
- si (software interrupts): CPU time spent serving software interrupts
- st (stolen time): CPU time spent running virtual machines
That might look like a lot, but you can look at the id and wa values at a glance. The idling time value should be high, and the waiting value should be low. If the idling value is low, the CPU is constantly doing a lot of work. If the waiting time is high, then the CPU is waiting a lot for I/O to complete and is hanging.
htop
A cleaner-looking version of top is the htop command:
$ htop
This command will also launch an interactive system monitor. It shows you the Load Average, your highest CPU usage processes, and a graph of your CPU core utilization.
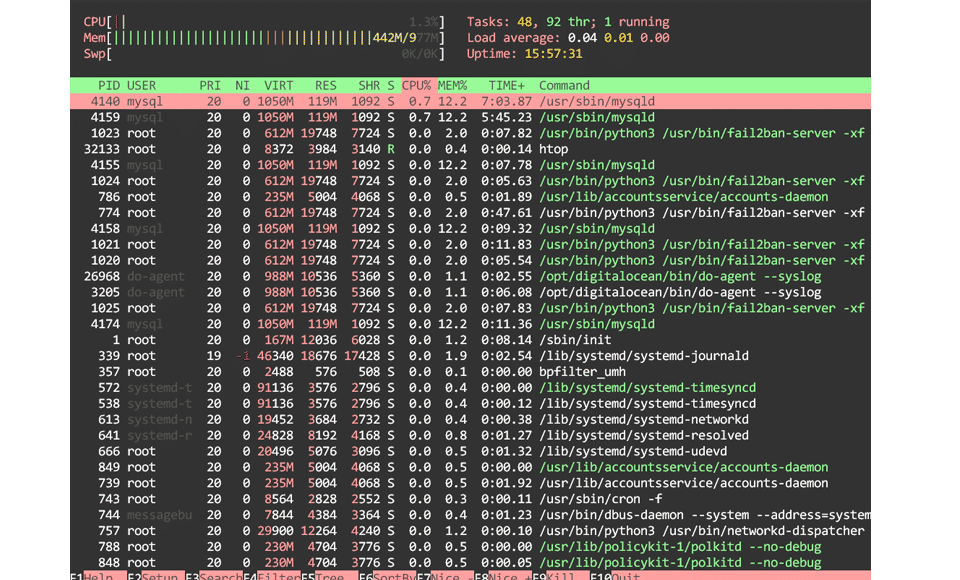
The htop command typically doesn’t come preinstalled. You can use sudo apt install htop to install it.
The htop monitor is straightforward to look at and understand and is our preferred monitoring tool. It’s typically the first tool we launch to start diagnosing any server issues.
nmon
Another detailed monitoring tool is nmon developed by Nigel Griffiths of IBM.
$ nmon
You can install nmon by using sudo apt install nmon command.
Once nmon is launched, you can hit the c key to show the CPU utilization graph showing the CPU cores with the usage and idle time. Hit the t key to also show the Top Processes to perform further diagnostics.
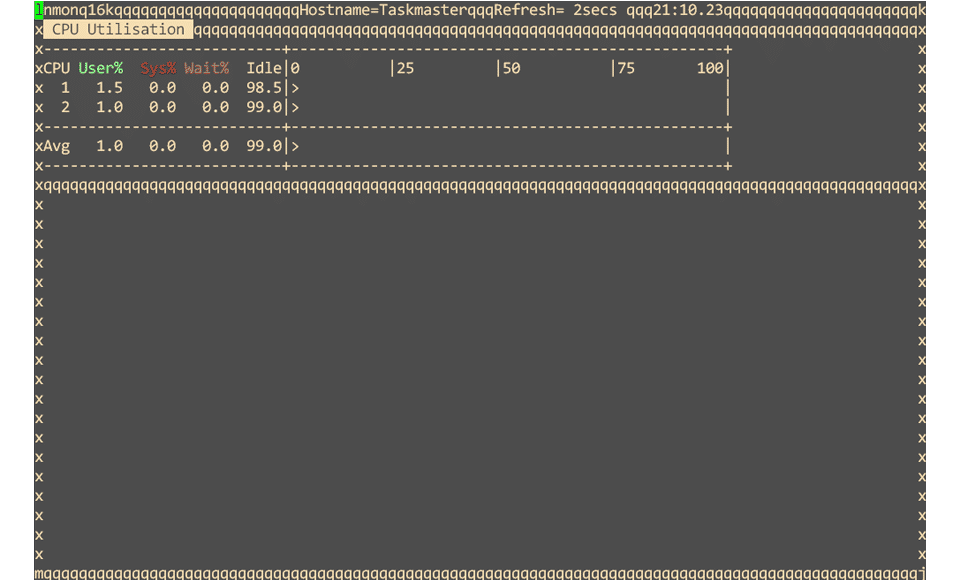
Other information nmon can display is memory, network, disk i/o usage, and more. You can remove any monitoring screen by hitting its original key again, giving you some dashboard customization.
Wrapping Up
Those are just some of the popular Linux tools for monitoring CPU usage. It’s important always to make sure you are correctly sizing your servers for the workload they will be performing. From the list above, htop is our favorite tool and allows us to monitor our systems easily.
If you found this guide useful, you should check out our Ubuntu section.