How To Debug Cumulative Layout Shift in Chrome Dev Tools
After Google’s announcement that Core Web Vitals will be a factor for search rankings, developers have been scrambling to boost website performance. One metric everyone has been struggling with is improving their Cumulative Layout Shift (CLS). In this article, you will learn what CLS is and How to debug Cumulative Layout Shift in Chrome Dev Tools.
What is Cumulative Layout Shift
A Layout Shift happens when a website loads data into the DOM asynchronously, and content on the page gets shifted down. Because of the wide adoption of Javascript and async loading of content, this issue is widespread. A website may have multiple elements shift individually, and the summation of these elements gives us the Cumulative Layout Shift metric. A high CLS provides the user with a bad experience as elements begin to shift around the screen and can even potentially cause misclicks.
How to Check Your Cumulative Layout Shift
There are multiple ways to check for CLS, but since we will be working in Google Dev Tools. We will use Lighthouse inside of Google Dev Tools to measure our CLS.
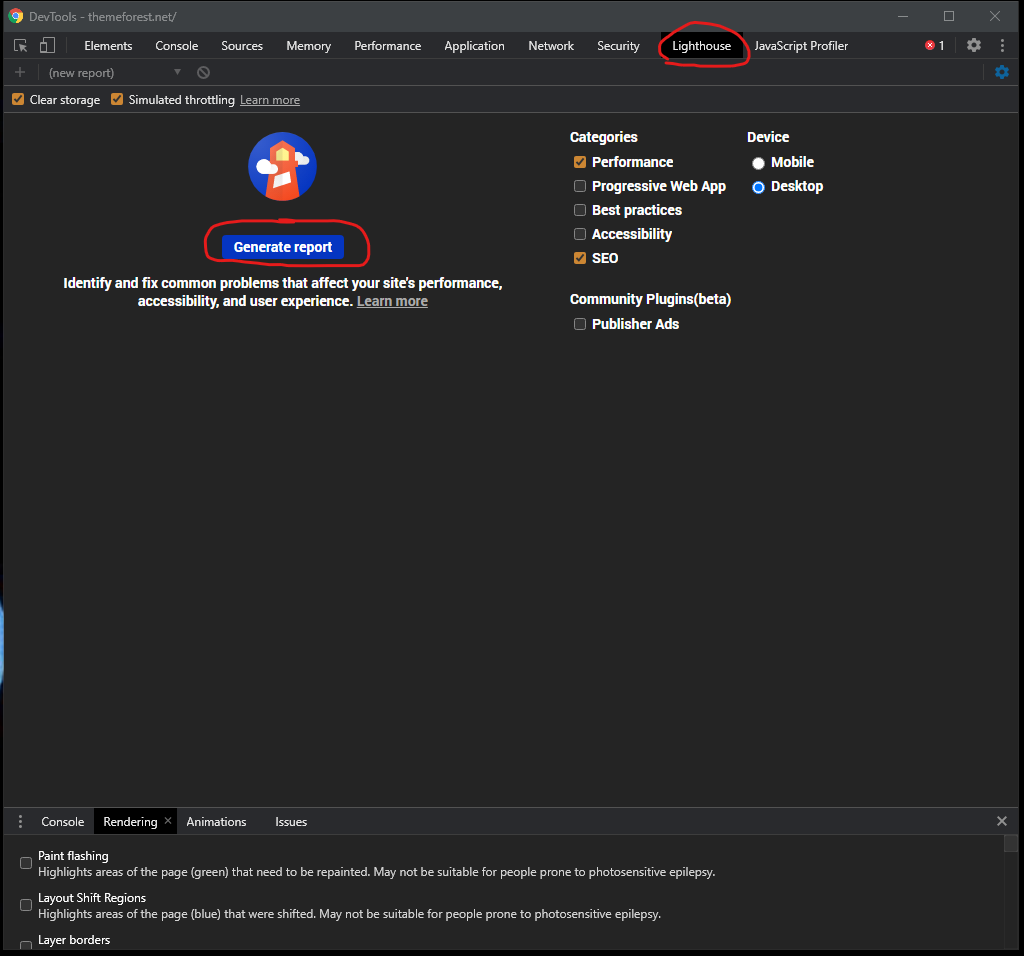
Open Chrome Dev Tools by hitting CTRL + SHIFT + I (Windows) or CMD + Option + I (Mac) and click the Lighthouse tab at the top. Make sure Performance is check and hit Generate Report.
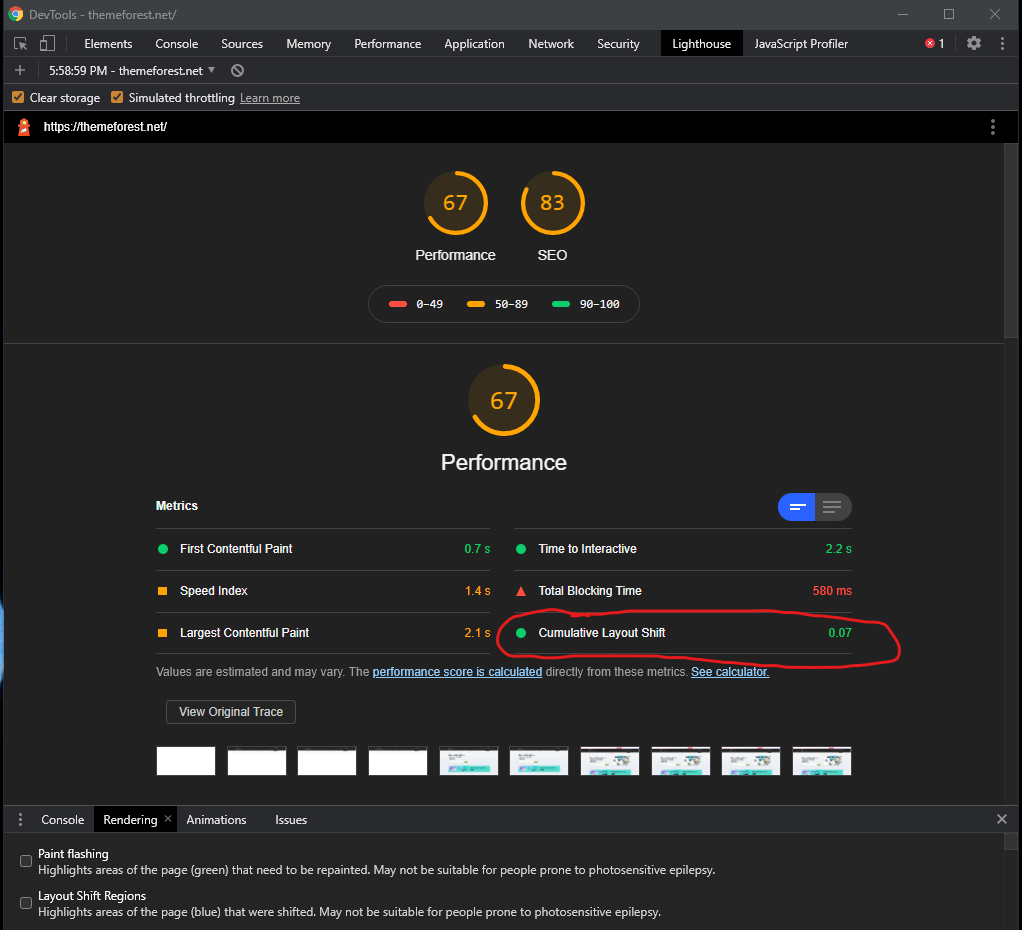
Allow a few minutes for Chrome to generate the Lighthouse report. Once it’s completed, you will see multiple metrics for your website. One of these will be your Cumulative Layout Shift. If it’s above 0.5, it is considered to be high.
How to Debug Cumulative Layout Shift in Chrome Dev Tools
Now that we have a CLS metric, we need to identify the elements that are causing it. Google Dev Tools makes this easy.
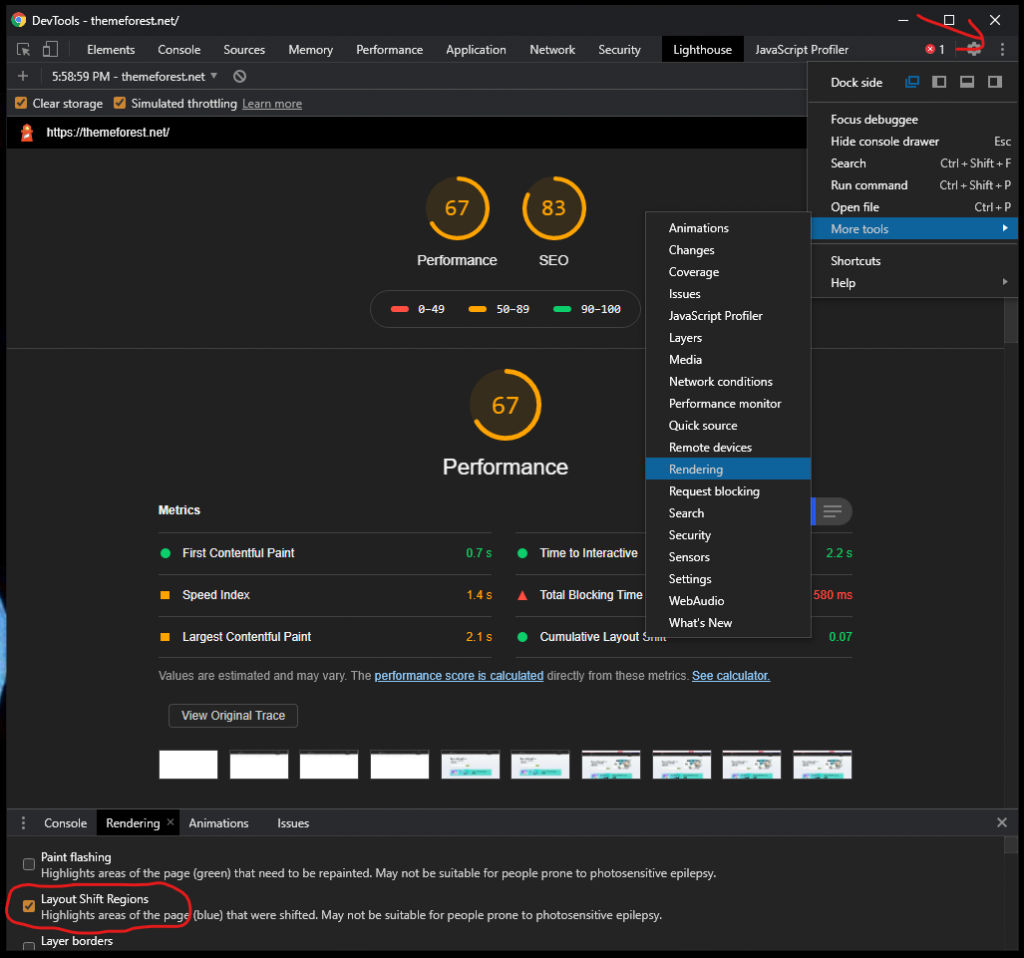
Click on the Menu at the Top Right Corner of Dev Tools. Then click on More Tools and click on Rendering.
A rendering tab should now be available for you. With this tab selected, make sure to check Layout Shift Regions.
Now go to your page and refresh it. You will see a blue box pop up over your elements for a split second. This box represents your Layout Shift. You will want to focus on these elements and make sure they do not shift other elements on your page when they load.
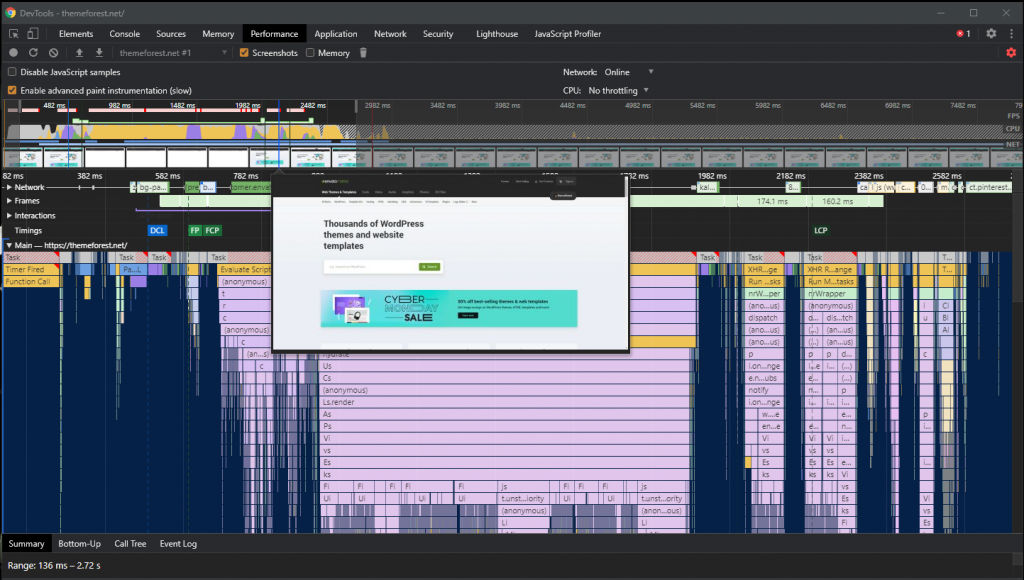
You can also watch your site load frame by frame. While Still in Chrome Dev Tools, click on the Performance tab, make sure Screenshots is checked, and hit the small refresh button. Chrome will build out a performance profile for you, and you will be able to go through the timeline frame by frame and look at your site’s rendered screenshots. Look for any elements shifting between frames.
Now you know how to debug Cumulative Layout Shift using Chrome Dev Tools. There are tons of useful tools inside Google Chrome, and featured are continually being added. Try out some of the techniques in this article and see if you can improve your site’s CLS.